Bad Data Visualizations: Three Mistakes Marketers Make and How to Avoid Them
-

- February 19, 2025
When you’re working with data, presentation is everything. Bad data visualizations can throw off your entire message. Here’s how to avoid three common mistakes.
It’s true that a picture is worth a thousand words. It’s also true that a powerful visualization can sometimes be worth more than pages of text or spreadsheets of data — and marketers should remember this when communicating the outcome of their efforts. When reporting data, strong visualization could be your best tool for illustrating the impact of your programs and the return on investment.
Company executives expect marketing teams to deliver insights that can inform business decisions and clearly define success metrics, but drawing actionable conclusions from a spreadsheet of data can be cumbersome and time consuming. Data visualization can help represent complex information in a digestible form, without overwhelming the audience.
With that in mind, here are three common data reporting mistakes to avoid.
Mistake #1: Making the reader work for insights.
Don’t assume that if you throw all the data into a table or graph the results are obvious. Good communication requires context, and your audience probably doesn’t have time, or won’t take the time, to inspect the data. Whatever observation you’d like to highlight, go ahead and spell it out. That means including insights in text format in addition to a graph or table. If you’re using a graph, use callouts for key events. When showing an increase or decrease, calculate that difference for your audience.
Mistake #2: Including too many data points in one graph.
It can be tempting to share all the information at your disposal, but too much data in one visualization obstructs the key takeaways. Ask yourself what your audience cares about the most – campaign goals, KPIs, conversions – then pare everything else back.
Some data points seem related but aren’t necessarily helpful when comparing performance. For example, sales revenue might have significantly increased year over year, but so did ad spend. In this case, compare apples to apples by including rates, such as return on ad spend.
Ideally, graphs should be limited to communicating one data point unless they are illustrating correlation. If you find yourself trying to communicate too many different ideas, consider creating a second graph.

Too many data points detract from the key message.
Mistake #3: Using the wrong scale.
Always start at zero. Whether you’re looking to more dramatically show gains or just want to save space by making the graph smaller and only highlighting wins, graphs that do not start at zero can be misleading.
For example, the two graphs below illustrate growth in Twitter followers. A quick glance at the first graph indicates that followers have more than doubled in the past year. But closer inspection of the vertical axis shows the scale doesn’t start at zero. Because of this, the first graph inflates the success of the past year and can cause decisions to be made based on inaccurate assumptions. The two graphs below communicate the same information, but one gives a clear picture of incremental growth whereas the other seems to be indicating huge strides in performance.
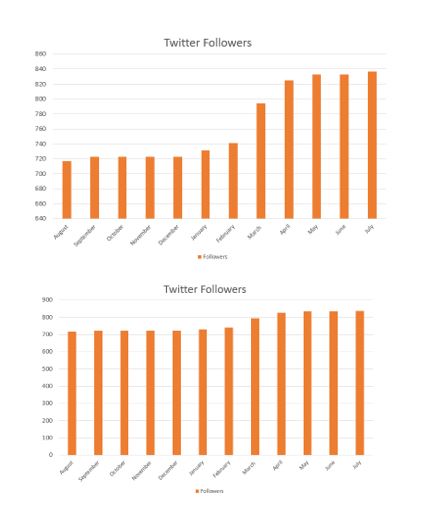
Notice: the graph on the bottom starts at zero.
Scale applies to area as much as it does to the axis. Consider the graph below “Comparison Statistics.” From January to April, the value of A and B increased by about five times. However, in this visualization, the bars for each month are also growing wider instead of only taller. In this instance, the A and B bars should remain a uniform width to accurately display the value growth (such as with the orange uniform bars in the Twitter graph above), so the data is perceived accurately. While it’s true that we can reference the scale of the y-axis (vertical), this requires that the audience work for that insight, which is covered above in mistake #1.

Make the bars uniform to avoid confusion.
Pie charts are too often used as a visualization in the wrong context. We’ve all seen pie charts where the percentages don’t equal 100, leaving out pieces of data and requiring the audience to do calculations to interpret the meaning.
It’s important to base the percentage on the total and not leave out categories that seem unimportant. For example, in the chart below, it looks like California makes up over a third of sales. However, the chart displays only the top five regions and doesn’t show what percentage of total sales the top five regions generate. This data reporting overemphasizes California’s importance to the organization.

The numbers in this pie graph do not equal 100%.
Are data visualizations necessary?
Data visualization can go a long way in illustrating the impact of marketing on company growth. Building brand awareness is no longer enough. Today, marketing departments are expected to directly contribute to growth by filling the new business pipeline and by converting leads into customers. The ability to interpret and present data is an important skillset for marketers.
Support better marketing decisions with clearer data visualization with insights from The Ultimate Growth Marketing Playbook, which outlines how to align strategy, tools and teams around meaningful measurement.
For more information, contact us at inquiries@standingpartnership.com.